10 min read
Every way a cron job fails
Nine distinct failure modes for scheduled jobs, what each one looks like in production, and which of them a curl at the end of your script can actually catch.
cronmonitoringreliability
Read
Grace periods, miss thresholds, escalation ladders and quiet hours — how to tune cron alerting so it wakes you for real failures and stays quiet for everything else.
At 03:14 your phone goes off. A job missed its window. By the time you have found your laptop the job has run, the monitor is green, and the incident consists entirely of you being awake.
Do that four times and you will mute the channel. Now you have a monitoring system that produces no alerts, which is the same outcome as having none, except it costs money and gives you confidence.
Alert tuning is the difference between those two states, and it is mostly four dials. This is how to set them.
Every dead-man’s-switch monitor has a deadline: by when should the next check-in have arrived? Two settings move it.
Period is how often the job is expected to report. Either a fixed interval
(“every 15 minutes”) or a cron expression evaluated in a real timezone
(0 4 * * * in Europe/Berlin, which is DST-correct — the reason to declare
the timezone rather than doing UTC arithmetic in your head twice a year).
Grace is how much lateness is normal. A backup that starts at 04:00 and takes anywhere from four to twenty minutes doesn’t need an alert at 04:05. Grace is the answer to “how late is late enough to be worth knowing about”, and it should be set from the job’s actual observed variance, not from a round number you like.
The common mistake is setting grace too tight and then wondering why the monitor flaps. If a job’s runtime has ever legitimately been eleven minutes, a five minute grace is a promise to page you about normal behaviour.
Once the deadline passes, you have a choice: alert immediately, or wait to see whether the next one also misses.
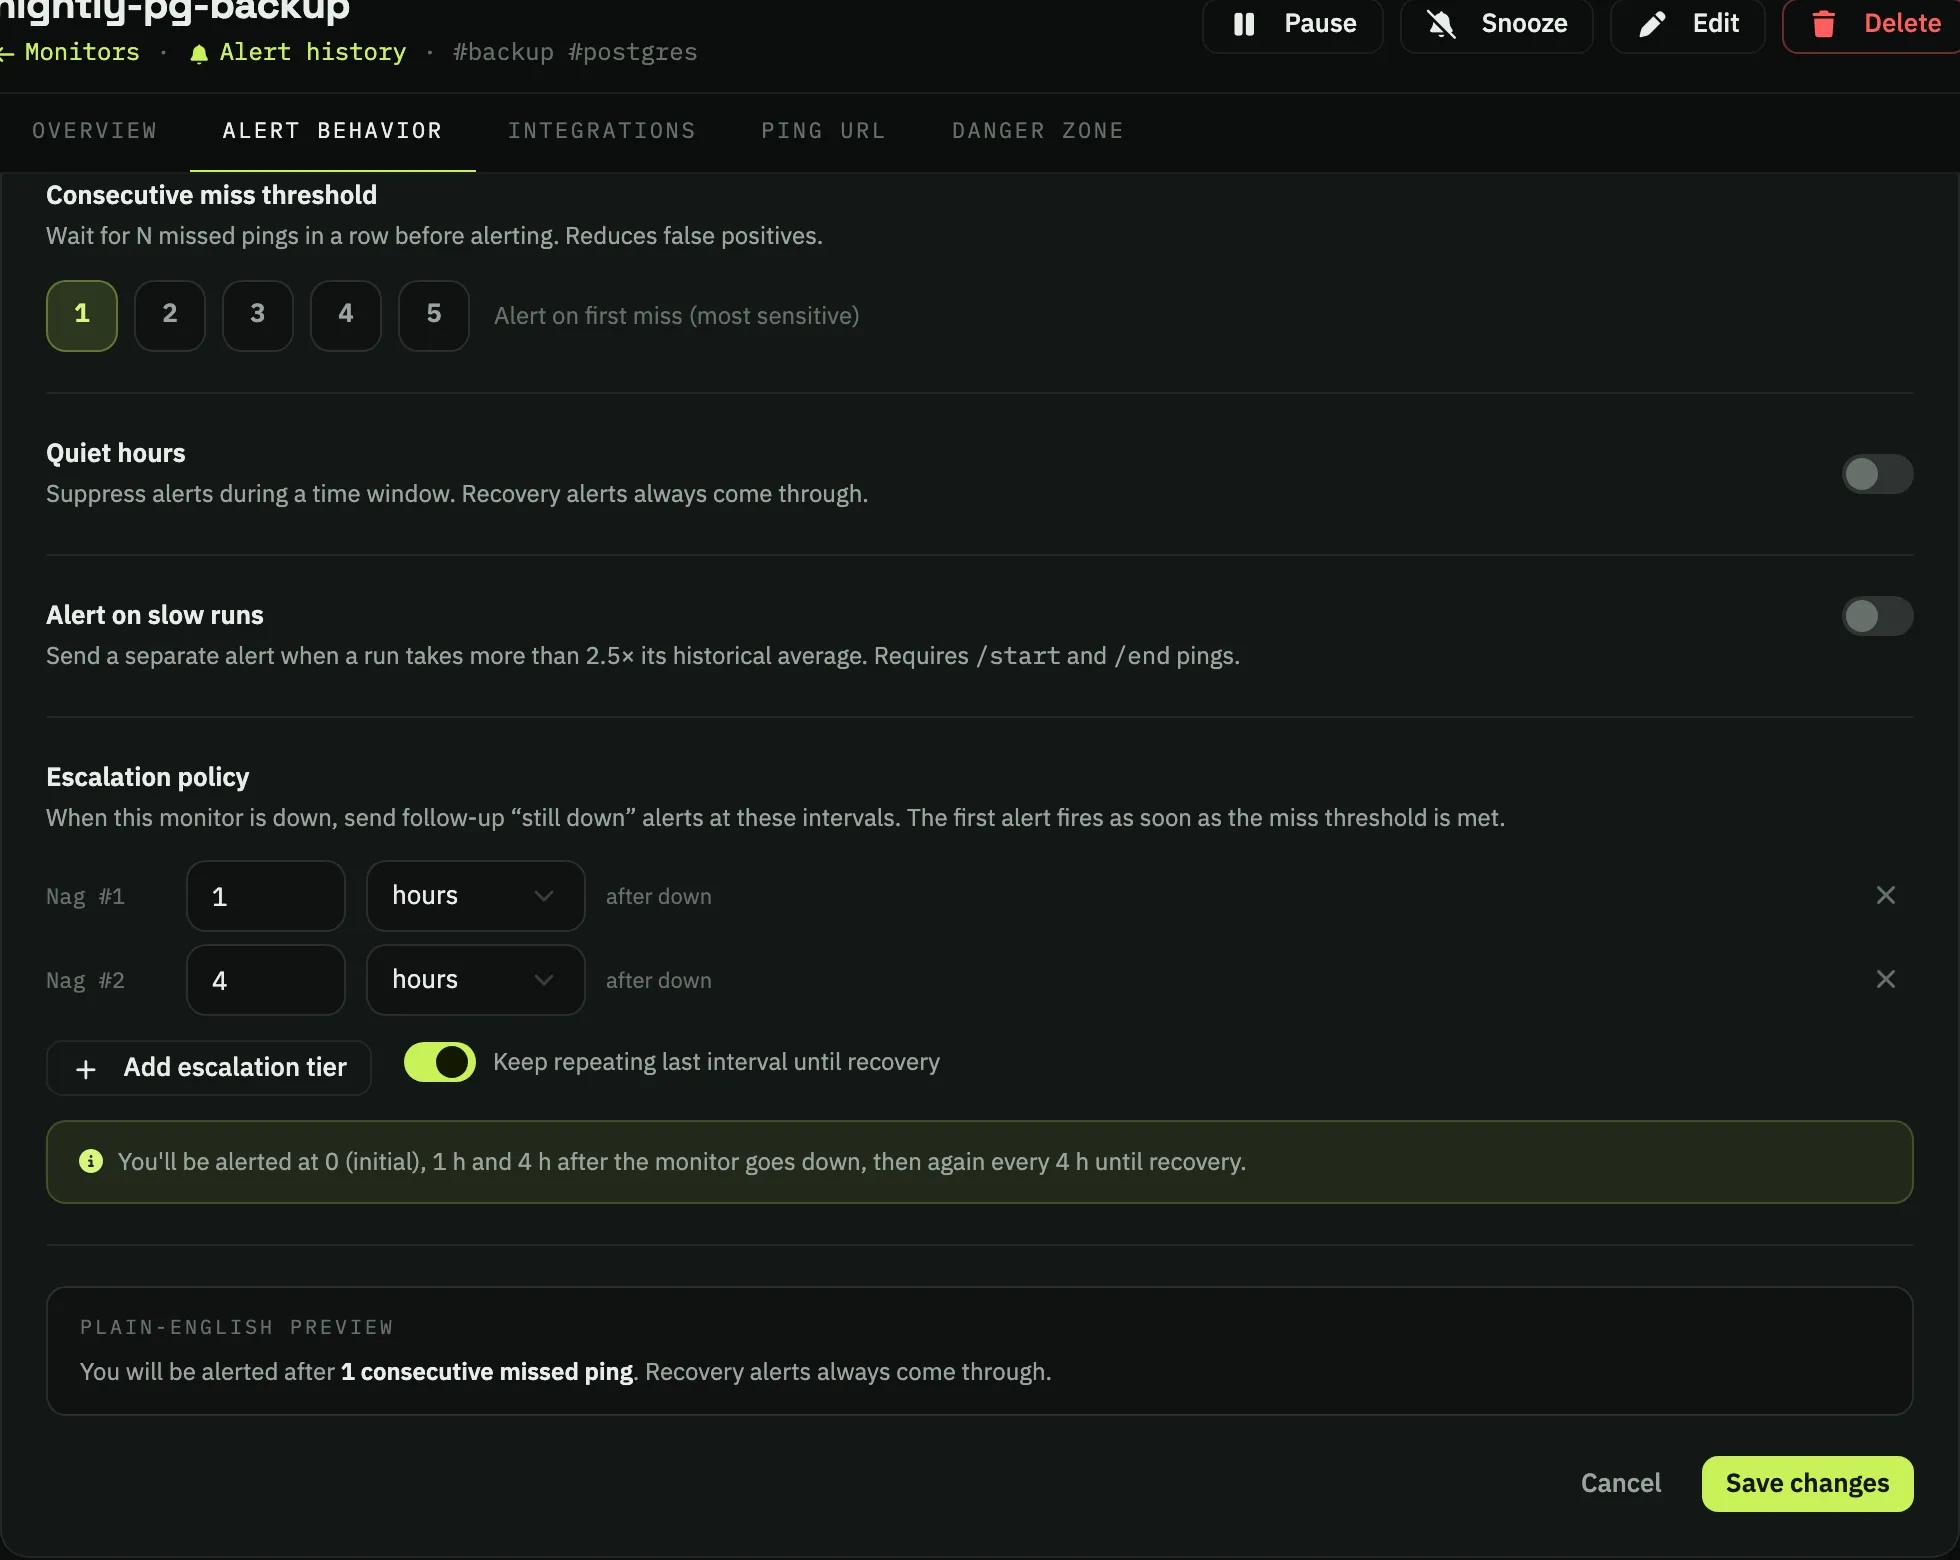
A consecutive miss threshold of 1 means “alert on the first miss” — the most sensitive setting. Raising it to 2 means the job has to miss twice in a row.
The trade is entirely detection latency against noise, and it’s arithmetic:
| Period | Grace | Threshold | You hear about it after |
|---|---|---|---|
| 15 min | 5 min | 1 | ~20 min |
| 15 min | 5 min | 2 | ~35 min |
| 15 min | 5 min | 3 | ~50 min |
| 1 day | 30 min | 1 | ~30 min |
| 1 day | 30 min | 2 | ~1 day 30 min |
Look at the last row. On a daily job, a threshold of 2 means the second miss is tomorrow — you have configured yourself a 24-hour detection delay. This is the single most common way people accidentally turn off a monitor while believing they made it less noisy.
The rule that falls out of the table:
Quiet hours suppress alerts during a daily window in a named timezone. The legitimate use is real: a staging environment that nobody will act on until morning, a report generator whose failure genuinely waits.
Two things to get right.
Recovery always comes through. Waking up to “it broke at 02:00” with no follow-up is strictly worse than not being told, because you start the day assuming it’s still broken. Recovery alerts ignore quiet hours for that reason.
The urgency test. Before enabling quiet hours on a monitor, ask: if this fails at 02:00, does someone need to act before 09:00? If the answer is yes — and for anything touching data integrity, backups, or billing it usually is — quiet hours are not a tuning knob, they’re a decision to accept seven hours of unattended breakage.
Here is the failure mode nobody designs for. The alert fires correctly. It lands in a Slack channel at 02:00. Nobody is looking at Slack at 02:00. In the morning it is nineteen messages up and the job has been down for seven hours.
The alert was delivered. It was also completely useless.
An escalation policy is the fix: after the initial alert, send follow-ups at increasing intervals for as long as the thing is still broken.
initial → +1h → +4h → every 4h until recoveryThat last clause matters more than the ladder. “Keep repeating the last interval until recovery” is the difference between a monitor that gives up after two nudges and one that stays annoying until a human deals with it. Use it for anything where the correct end state is somebody fixed this rather than somebody saw this.
The corollary is that escalation and miss thresholds pull in opposite directions, and that’s fine. A sensitive threshold with a patient escalation ladder — tell me early, keep telling me — is usually a better shape than a conservative threshold that fires once into the void.
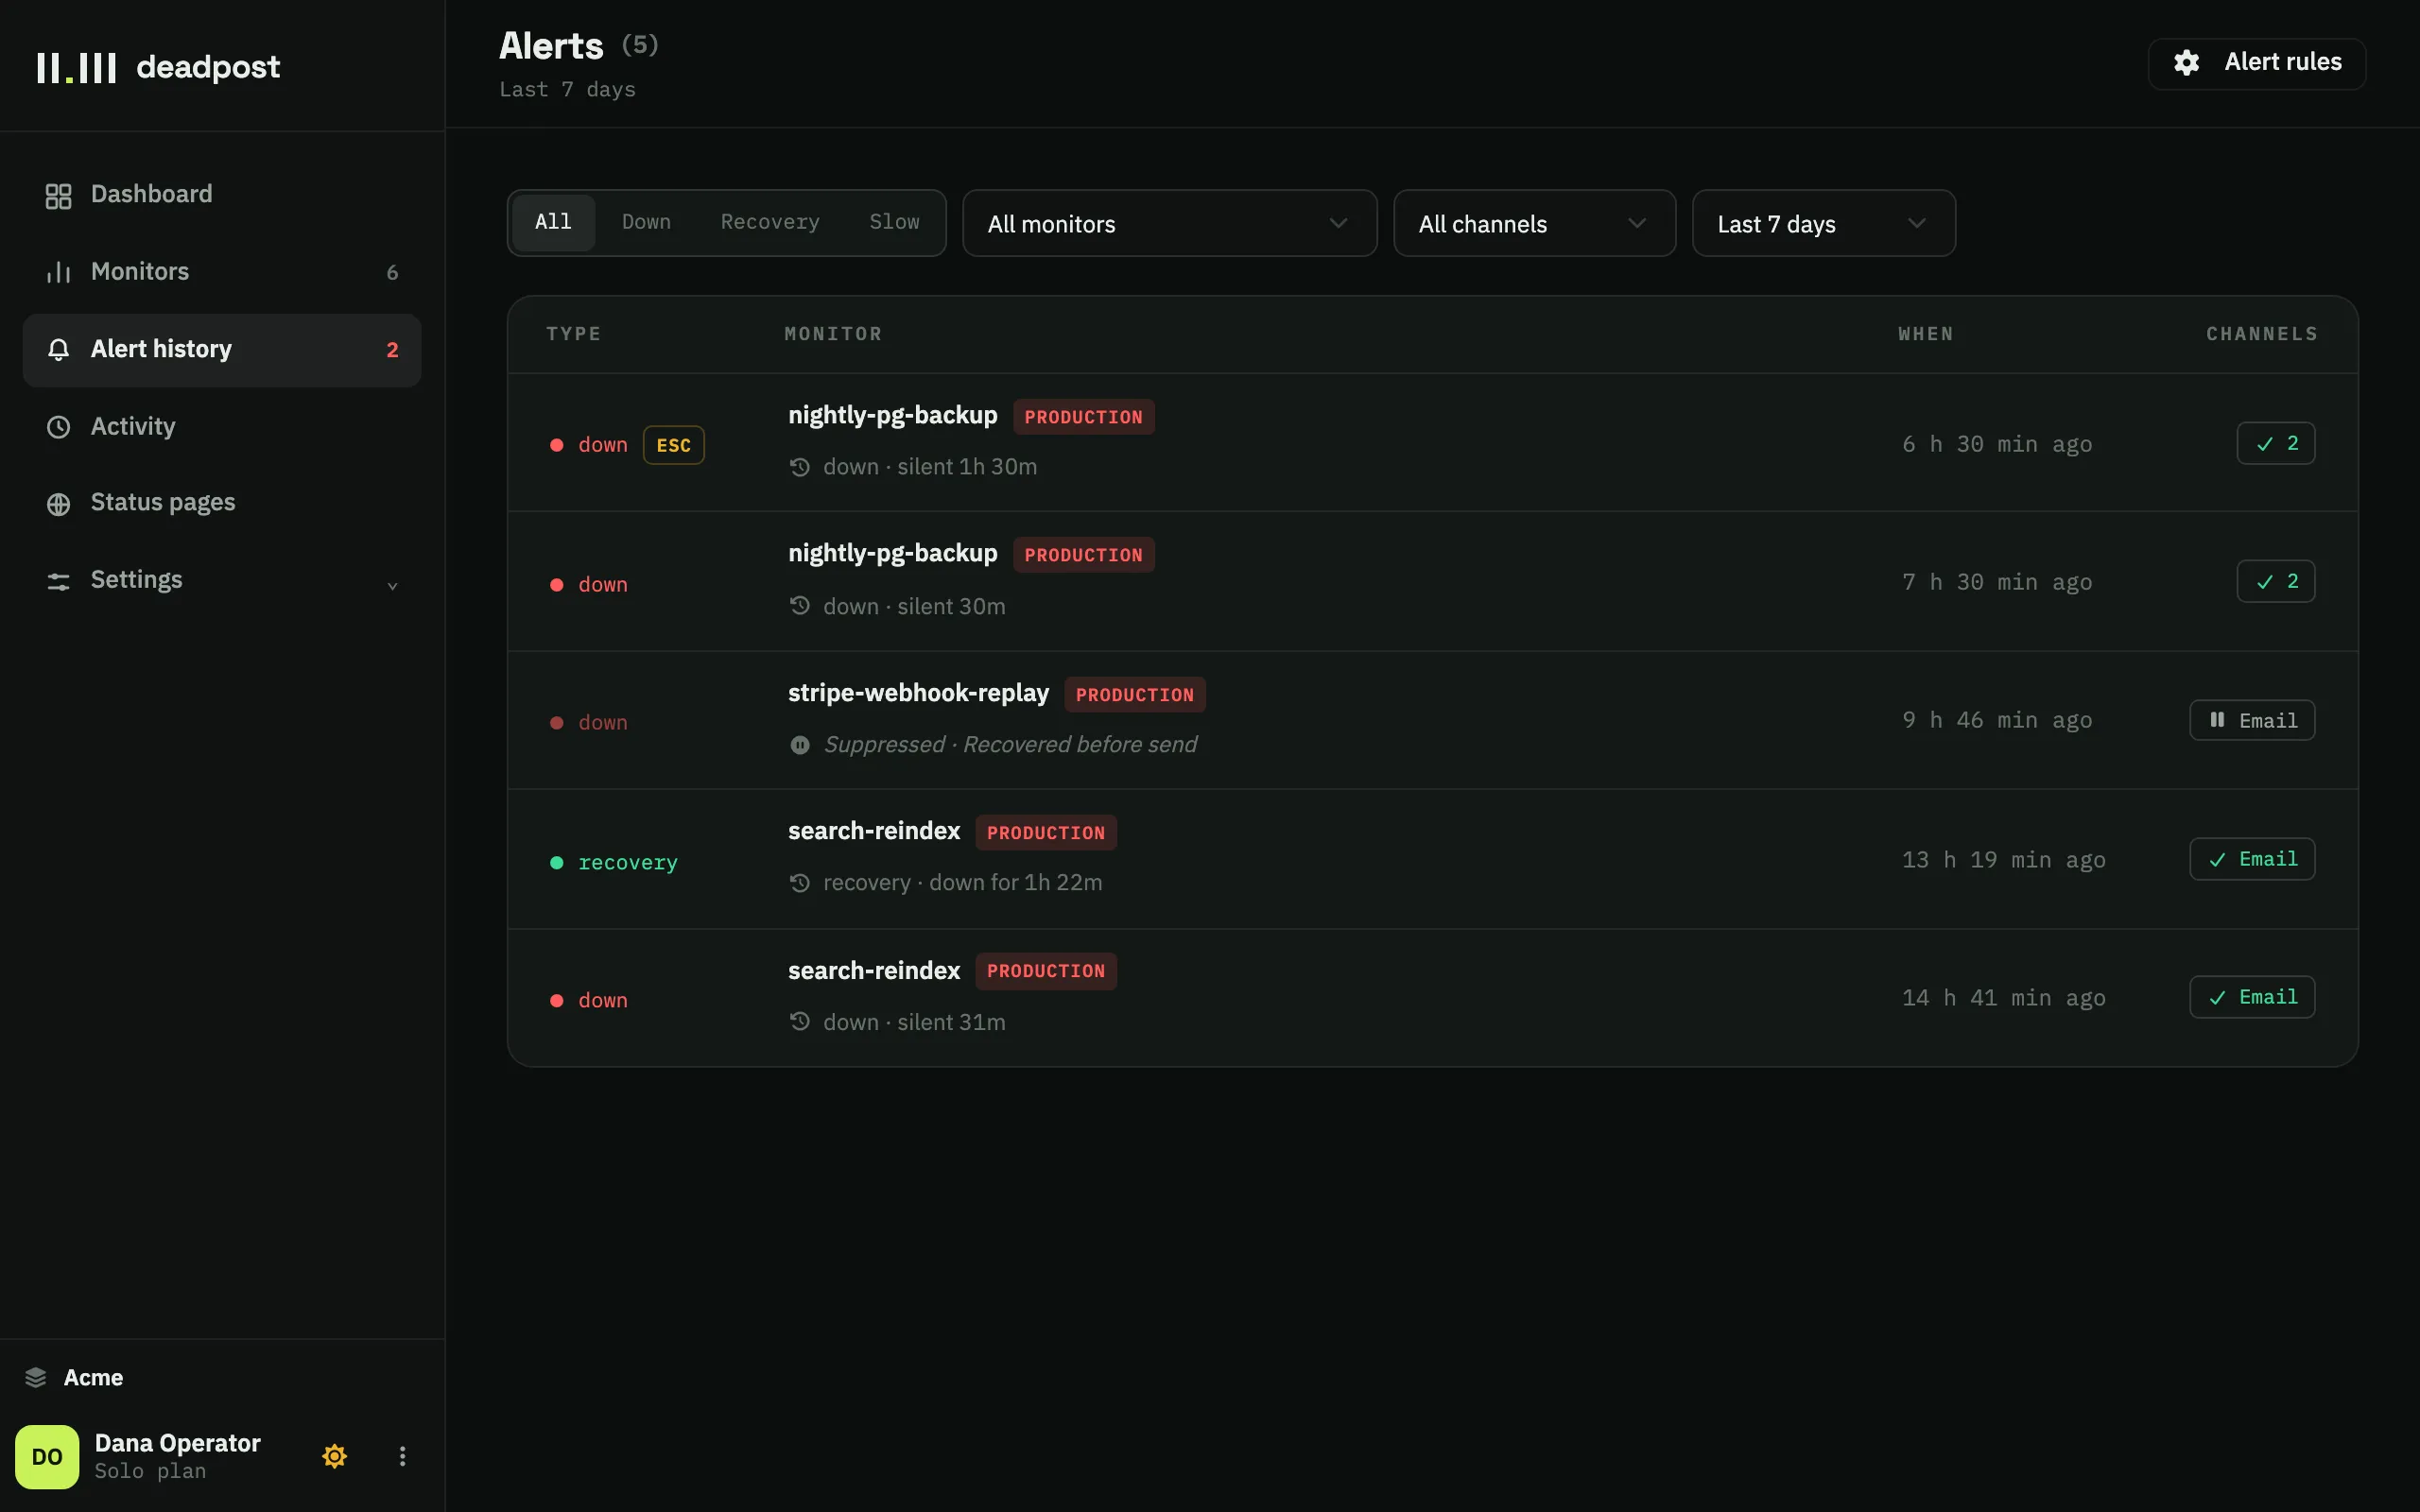
The most useful row in that screenshot is the greyed-out one: “Suppressed · Recovered before send.”
That is an alert that was queued and then deliberately not sent, because the job recovered in the gap between deciding to alert and delivering it. It is the system absorbing a blip on your behalf — the 03:14 page from the top of this post, not happening.
There are four suppression reasons and they split into two categories that should never be conflated:
We chose not to send:
We tried and failed:
The first three are informational. The last is an incident in your monitoring system, and rendering it under the same “suppressed” icon as the others would tell you an alert was held back when in fact it was lost. Check for it periodically; a monitor that cannot deliver is a monitor that isn’t running.
Frequent recovered before send rows on the same monitor are also a signal, and the signal is “your grace period is too tight.” The system is quietly cleaning up after a config that doesn’t match reality.
The last dial, and the one that costs people the most.
Pause stops evaluation. Use it when the job is legitimately not running — a migration, a decommissioned service, a seasonal batch that only runs in December. Nothing is expected, so nothing is missed.
Snooze stops delivery. Evaluation continues, the state history stays honest, and you simply aren’t told again for a while. Use it when you are already looking at the problem.
Reaching for pause when you meant snooze is how monitors die. Pause it “for now”, fix the thing, forget to resume, and three months later you discover the job stopped in week two. This is why an auto-resume time matters: paused until 09:00 tomorrow is a decision, paused indefinitely is an intention, and intentions decay.
If you find yourself pausing a monitor during an incident, that’s snooze.
Not a rule set — a starting point to adjust from once you’ve watched a monitor for two weeks.
| Job type | Period | Grace | Threshold | Escalation | Quiet hours |
|---|---|---|---|---|---|
| Nightly backup | cron, tz-aware | 30 min | 1 | 1h, 4h, repeat | never |
| Billing / invoicing | cron, tz-aware | 15 min | 1 | 1h, 4h, repeat | never |
| Hourly ETL | 1 h | 15 min | 1 | 2h, repeat | no |
| Cache warmer (5 min) | 5 min | 2 min | 3 | none | yes |
| Session cleanup (1 h) | 1 h | 20 min | 2 | 4h | yes |
| Staging anything | as prod | generous | 2 | none | yes |
The pattern: anything that touches data you cannot regenerate gets threshold 1, a real escalation ladder, and no quiet hours. Everything else can be tuned for your sleep.
One question tells you whether your alerting is tuned:
When this monitor fires, do you look at it?
If yes, it’s tuned. If you glance and think “probably fine” — it isn’t, and raising the threshold or widening the grace is the fix. If you’ve muted the channel, the monitor is decoration, and the config that produced it needs throwing away rather than adjusting.
Alert fatigue is not a personal failing. It is a rational response to a system that cries wolf, and the fix is always in the configuration, never in trying harder to care.
Nine distinct failure modes for scheduled jobs, what each one looks like in production, and which of them a curl at the end of your script can actually catch.
A cron-monitoring vendor comparing itself to healthchecks.io. Where deadpost is genuinely different, where healthchecks.io is genuinely better, and how to migrate in about a minute.