8 min read
The 3am page you shouldn't have gotten
Grace periods, miss thresholds, escalation ladders and quiet hours — how to tune cron alerting so it wakes you for real failures and stays quiet for everything else.
alertingon-callmonitoring
Read
Nine distinct failure modes for scheduled jobs, what each one looks like in production, and which of them a curl at the end of your script can actually catch.
Almost every cron monitoring setup starts the same way. Someone appends a curl to the end of a script:
0 4 * * * /usr/local/bin/pg_backup.sh && curl -fsS https://example.com/ping/abc123This is a real improvement over nothing. It catches the most common failure and it took eleven seconds to write. But it is worth being precise about what it does and does not see, because “the job is monitored” and “the job’s failures are monitored” are different claims, and the gap between them is where the 3am incidents live.
Below are nine distinct ways a scheduled job fails in production. They are genuinely distinct — different causes, different blast radius, different fixes — and the one-line curl catches roughly two of them.
The cron daemon isn’t running. The container was never scheduled. The host
rebooted and something in the boot order didn’t come back. The crontab line has
a syntax error and the whole file was rejected. Someone edited the crontab and
fat-fingered the schedule to 0 4 * * 7 on a machine where Sunday is 0.
This is the failure the trailing curl exists for, and it catches it perfectly: no job, no curl, no ping. Silence is the signal. Any dead-man’s-switch monitor handles this, and if this is the only failure mode you care about, the one-liner is genuinely enough.
It is also, in my experience, not the failure that hurts. Jobs that stop running entirely tend to get noticed. The ones below don’t.
The dump acquires a lock and waits forever. A psql connection stalls on a
network partition that never resolves into an error. A wget sits in a retry
loop against a host that accepts connections and then says nothing.
From the outside this is indistinguishable from #1: no curl fires, because the script never reached the last line. You will be told “the backup didn’t run.” That is wrong in a way that costs you the first twenty minutes of the investigation — you will go looking at cron and systemd, and the answer is a held lock in Postgres.
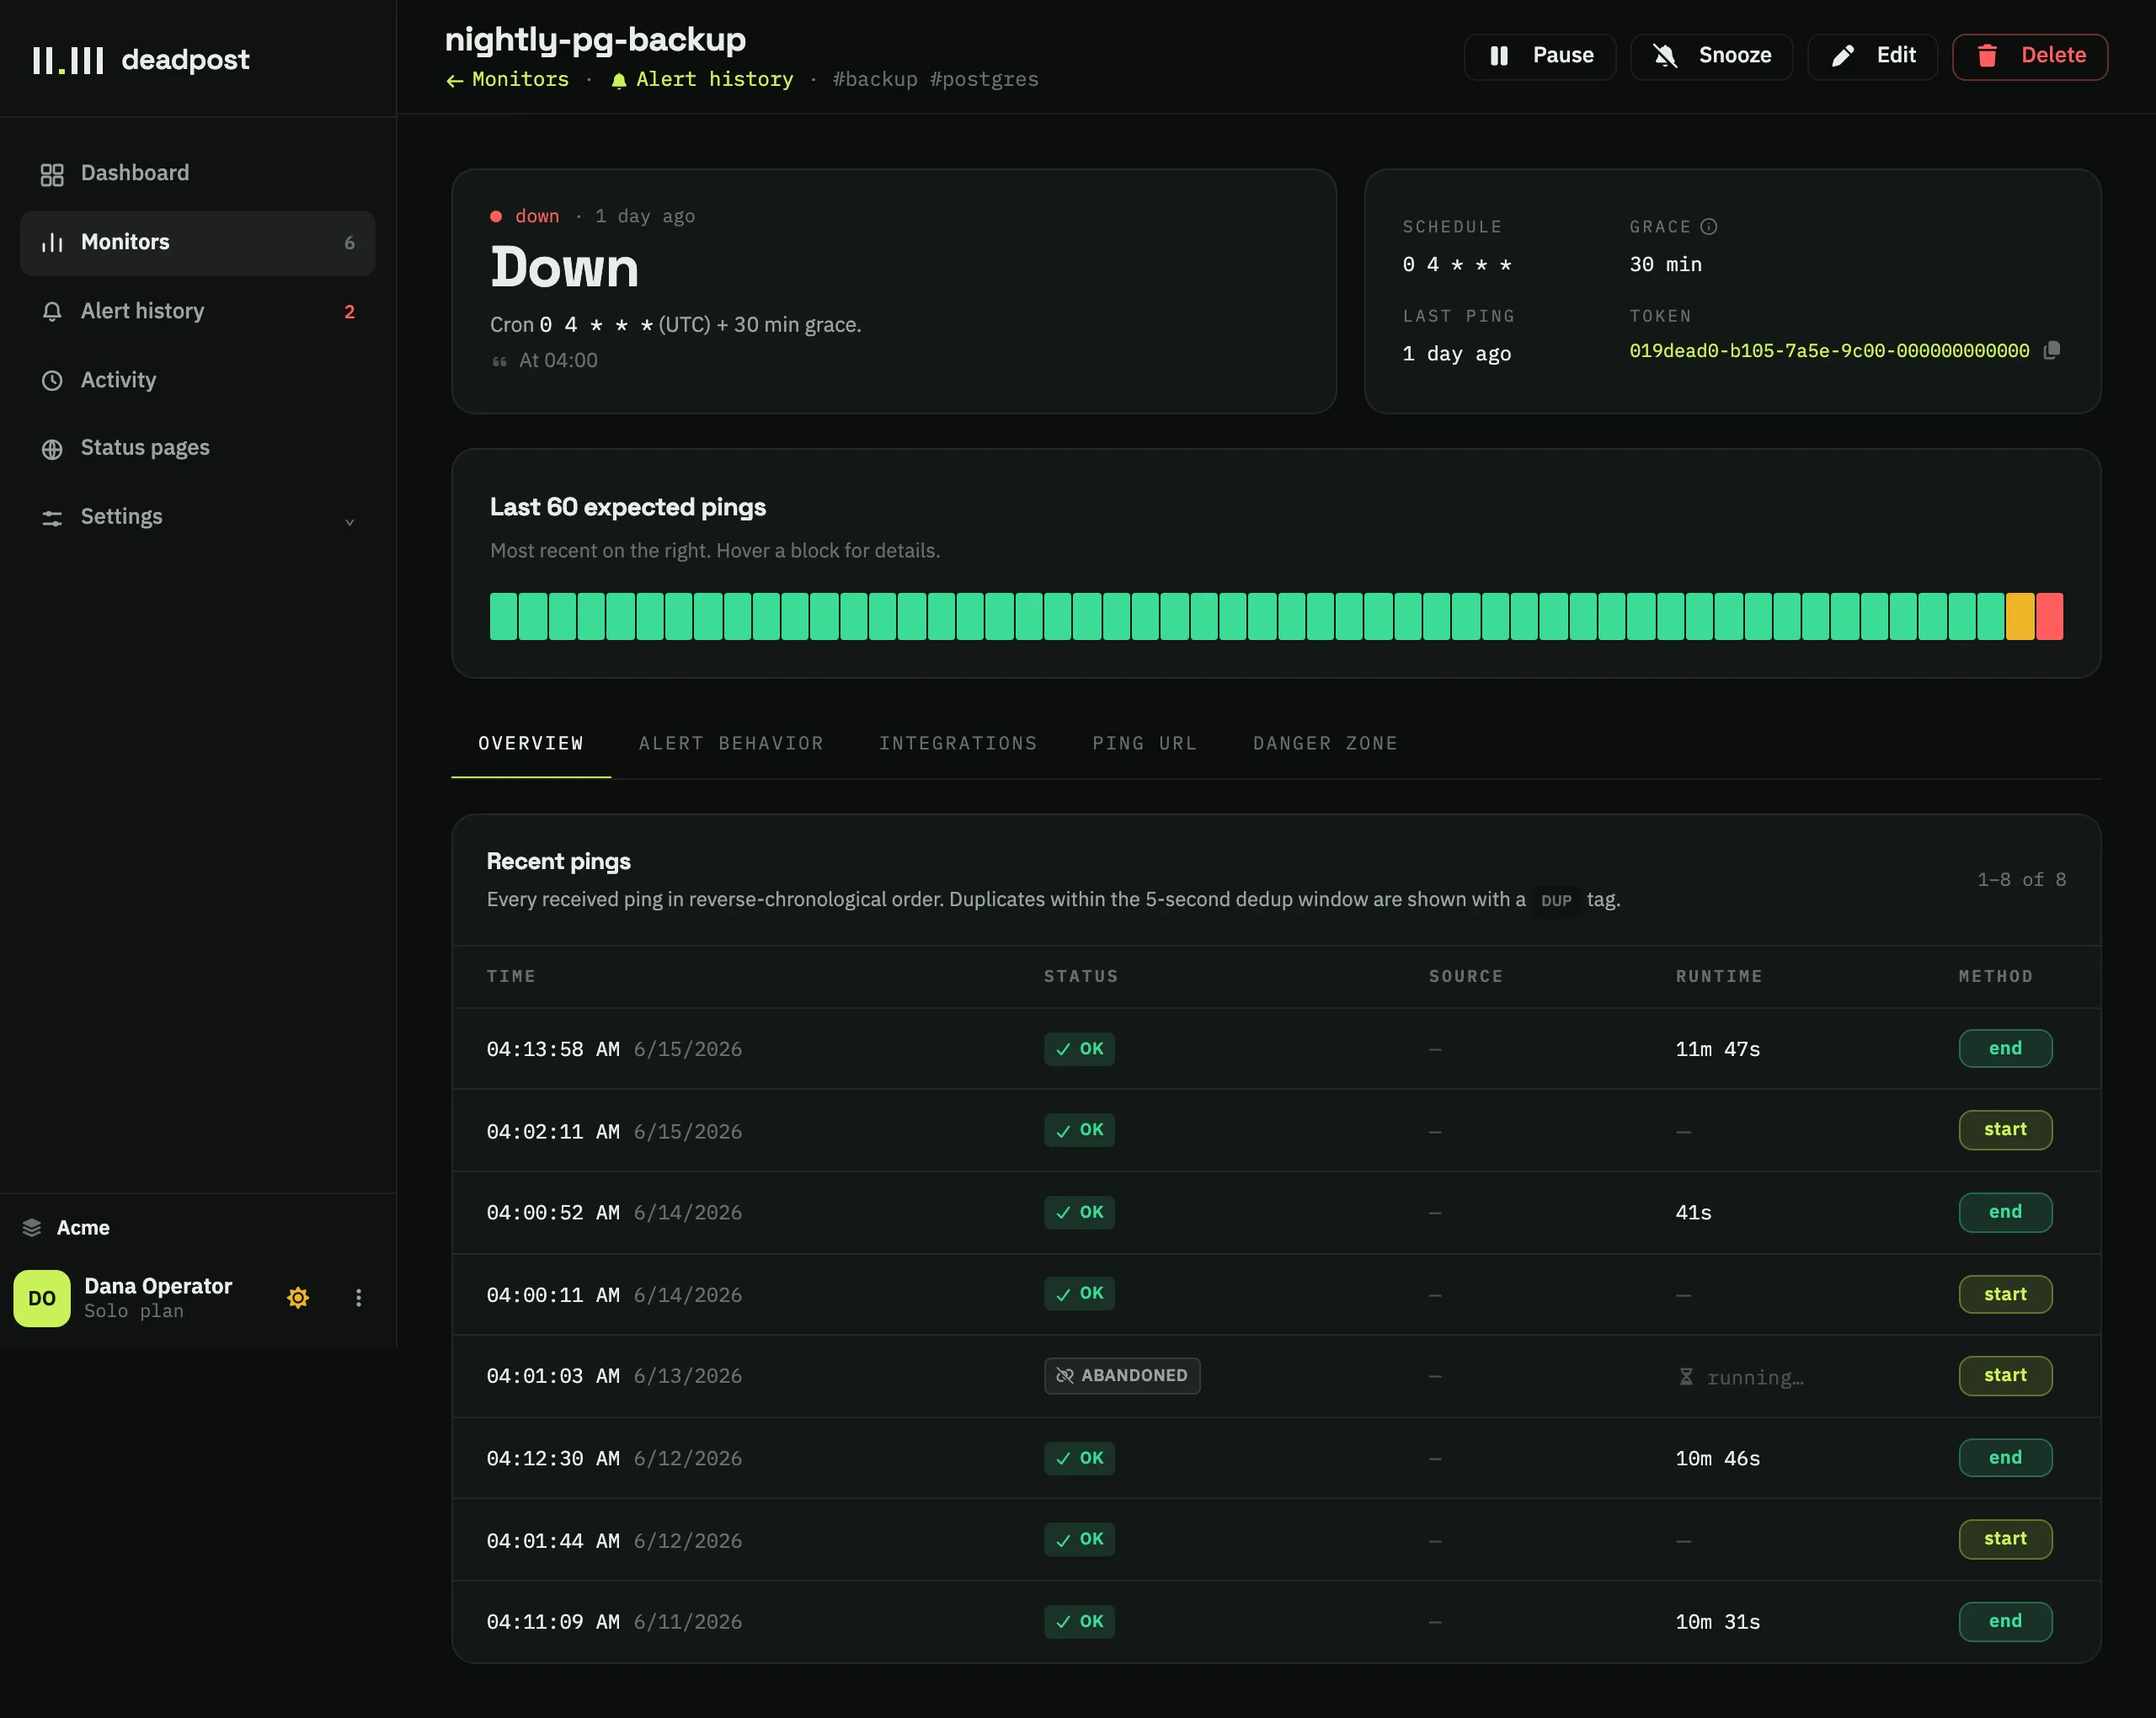
The fix is to report the start of the job as well as the end. Two calls instead of one:
0 4 * * * curl -fsS https://ping.deadpost.dev/<token>/start && \
          /usr/local/bin/pg_backup.sh && \
          curl -fsS https://ping.deadpost.dev/<token>/end
Now “never started” and “started and hung” are different states, and the second one is visible as an abandoned run — a run that opened and never closed.
The OOM killer took it. The deploy that restarted the box happened to land at
04:07. The container hit its memory limit and got SIGKILL, which by definition
runs no cleanup and no trap handler.
Same external signature as #2 — an open run that never closes — but note what
this means for any solution built on “trap EXIT and curl”: a SIGKILL doesn’t
run traps. The process is gone. Nothing in the job can report its own death.
This is one of the arguments for a start-ping over a clever exit handler. The start ping has already been delivered by the time the process dies; the monitor notices the missing end. An exit hook that never runs reports nothing.
The script ran, failed, and said so. This is the well-behaved failure.
Here the && in the one-liner does the right thing by accident: a non-zero exit
means the curl never runs, means silence, means an eventual alert. But note
eventual. You find out when the monitor’s grace period elapses, which for a
daily backup might be thirty minutes or two hours after the job already knew it
had failed.
Reporting the failure explicitly closes that gap:
0 4 * * * curl -fsS https://ping.deadpost.dev/<token>/start && \
          { /usr/local/bin/pg_backup.sh && \
            curl -fsS https://ping.deadpost.dev/<token>/end || \
            curl -fsS https://ping.deadpost.dev/<token>/fail ; }
A /fail forces the monitor down immediately rather than waiting out the
silence window. The difference between “alerted at 04:02” and “alerted at 04:30”
is often the difference between fixing it before the business day and explaining
it during.
If you’d rather not write that in shell, this is what the SDKs are for — an exception reports the failure and is then re-raised unchanged:
import deadpost

with deadpost.run() as run:
dump_database() # raises → /fail is sent, exception propagates untouchedThis is the one that ends careers.
The backup ran. It took eleven minutes, exited 0, and wrote 2 MB instead of 14 GB, because a credential rotated and the tool logged a warning to a file nobody reads before dutifully producing an empty archive. Every monitor you own is green. The trailing curl fired. The job “succeeded” every night for five weeks, and you find out when someone needs the backup.
No dead-man’s-switch catches this, including ours, because from the outside the job is indistinguishable from a healthy one. The only way to see it is to report something about the work, not just its completion:
import deadpost

with deadpost.run() as run:
    rows, size = dump_database()
run.tag(rows=rows, bytes=size)The honest advice today is: tag the numbers anyway. It costs one line, and the difference between “we think it broke sometime in July” and a chart of nightly byte counts is the entire post-mortem.
The previous run hasn’t finished when the next one starts. Now two pg_dump
processes are competing for the same lock, or two invoice mailers are sending
every customer two invoices.
A trailing curl is completely blind to this: it sees two successful pings, which
looks like a healthy job that ran on schedule. Even with start/end pings, the
second /start opens a second run and abandons the first, which shows up in the
run history as an abandoned run — a symptom, not a diagnosis.
Overlap is genuinely better solved at the source with a lock (flock is one
line and does not require a monitoring vendor):
0 4 * * * flock -n /var/lock/pg_backup.lock /usr/local/bin/pg_backup.shMonitoring tells you it happened. flock stops it happening. Do both, in that
order of importance.
The job that used to take four minutes now takes fifty. It still finishes. It still exits 0. It still pings. And in six weeks it will start overlapping with the next invocation, which is #6, which you now know is invisible.
Duration is the whole signal here, and you can only have it if the job reports both a start and an end. With those, “this run took 2.5× its historical average” becomes a thing that can be alerted on separately from “this job is down” — the two want different urgency and often different people.
The other half of “late” is arrival time rather than runtime: the job that used to land at 04:03 now lands at 04:47 every day. A monitor with a fixed period will flap in and out of its grace window; the fix is either a wider grace or an honest re-declaration of the schedule.
Egress rules changed. A corporate proxy started intercepting outbound HTTPS. The runner moved into a VPC with no NAT gateway. The job is completely fine and your monitor says it’s down.
This one produces false alarms rather than missed ones, which is less dangerous and more corrosive — a monitor that cries wolf gets muted, and a muted monitor catches nothing at all.
There’s a nastier variant worth knowing about. Captive portals, SSO proxies and zero-trust walls all answer an intercepted request with a redirect to a login page that returns HTTP 200. A naive client follows the redirect, gets a 200, and reports a successful check-in — for a heartbeat that was never delivered. Silent fake success, in the one code path whose entire job is to detect silence.
This is why every deadpost SDK refuses to follow redirects at all: redirect: 'manual' in fetch, http.ErrUseLastResponse in Go, an opener built without
HTTPRedirectHandler in Python. A 3xx on the ping path is never us — the edge
rewrites internally and never answers a check-in with a redirect — so a 3xx is
always something in between, and it is reported as a failure rather than
swallowed as a success.
Every layer above assumes the monitoring system successfully told you. It might not have. The SMTP provider bounced. The Slack webhook was revoked when someone left. The address is a distribution list that quietly stopped resolving.
A monitor that can’t deliver and doesn’t say so is worse than no monitor, because it manufactures confidence. The check for this is boring and worth doing: send a test alert down every channel you rely on, on a schedule you actually keep, and make sure failed deliveries are visible rather than logged somewhere you’d have to think to look.
In deadpost this surfaces in the alert history as a distinct suppression reason — “delivery failed” is rendered differently from “we deliberately held this back”, because conflating them tells you an alert was suppressed when in fact it was lost.
| # | Failure | Trailing curl |
/start + /end |
Needs more |
|---|---|---|---|---|
| 1 | Never started | ✅ | ✅ | — |
| 2 | Started, hung | ⚠️ looks like #1 | ✅ abandoned run | — |
| 3 | Crashed mid-run | ⚠️ looks like #1 | ✅ abandoned run | — |
| 4 | Exited non-zero | ⚠️ after grace | ✅ immediate via /fail |
— |
| 5 | Exited 0, did nothing | ❌ | ❌ | run tags (recorded, not alerted) |
| 6 | Ran twice | ❌ | ⚠️ visible after the fact | flock |
| 7 | Ran late / slow | ❌ | ✅ duration + slow alerts | — |
| 8 | Ping lost in transit | false alarm | false alarm | no-redirect clients, egress checks |
| 9 | Alert never delivered | ❌ | ❌ | visible delivery failures, periodic tests |
If you take one thing from this: the upgrade from one ping to two is where most of the value is. It converts three separate failure modes from “silence, cause unknown” into distinct, diagnosable states, and it costs one extra line in your crontab.
A reasonable progression:
None of this requires deadpost specifically. Steps 1–3 are four lines of shell
against any dead-man’s-switch service, and step 6’s answer is flock, which
ships with your distribution. What matters is knowing which failures your
current setup is blind to — because the failure that hurts is never the one you
designed for.
Grace periods, miss thresholds, escalation ladders and quiet hours — how to tune cron alerting so it wakes you for real failures and stays quiet for everything else.
A cron-monitoring vendor comparing itself to healthchecks.io. Where deadpost is genuinely different, where healthchecks.io is genuinely better, and how to migrate in about a minute.